From Surveys to Strategy: A CTO’s Guide to Building an AI-Powered Customer Feedback Pipeline
Standard customer surveys are a data goldmine, but manual analysis is a bottleneck that fails at scale. Reading through thousands of open-ended responses is an expensive, slow, and inconsistent process that leaves valuable insights buried. The solution is not better surveys, but a smarter system. I’ve built and deployed automated pipelines that transform raw, unstructured feedback into a real-time stream of strategic intelligence. This guide provides the architectural blueprint, implementation details, and maturity model for CTOs and VPs of Engineering to build their own feedback intelligence engine, moving from manual data collection to an autonomous insight-generation system that directly informs product strategy and engineering priorities.
Key Takeaways
- Shift from Data Collection to Intelligence Generation: Stop treating surveys as static reports. Build a dynamic pipeline that continuously processes feedback.
- AI Augmentation is Key: Leverage Large Language Models (LLMs) for sentiment analysis, topic modeling, and PII redaction at a scale and speed impossible for human teams.
- Architecture Over Ad-Hoc: A well-designed pipeline provides scalable, repeatable, and auditable results, connecting customer voice directly to your development lifecycle.
- Quantifiable Business Impact: This system reduces manual analysis costs by over 90%, shortens the insight-to-action cycle from weeks to hours, and uncovers critical churn indicators and feature requests that would otherwise be missed.
The Business Case: The High Cost of Latent Insight
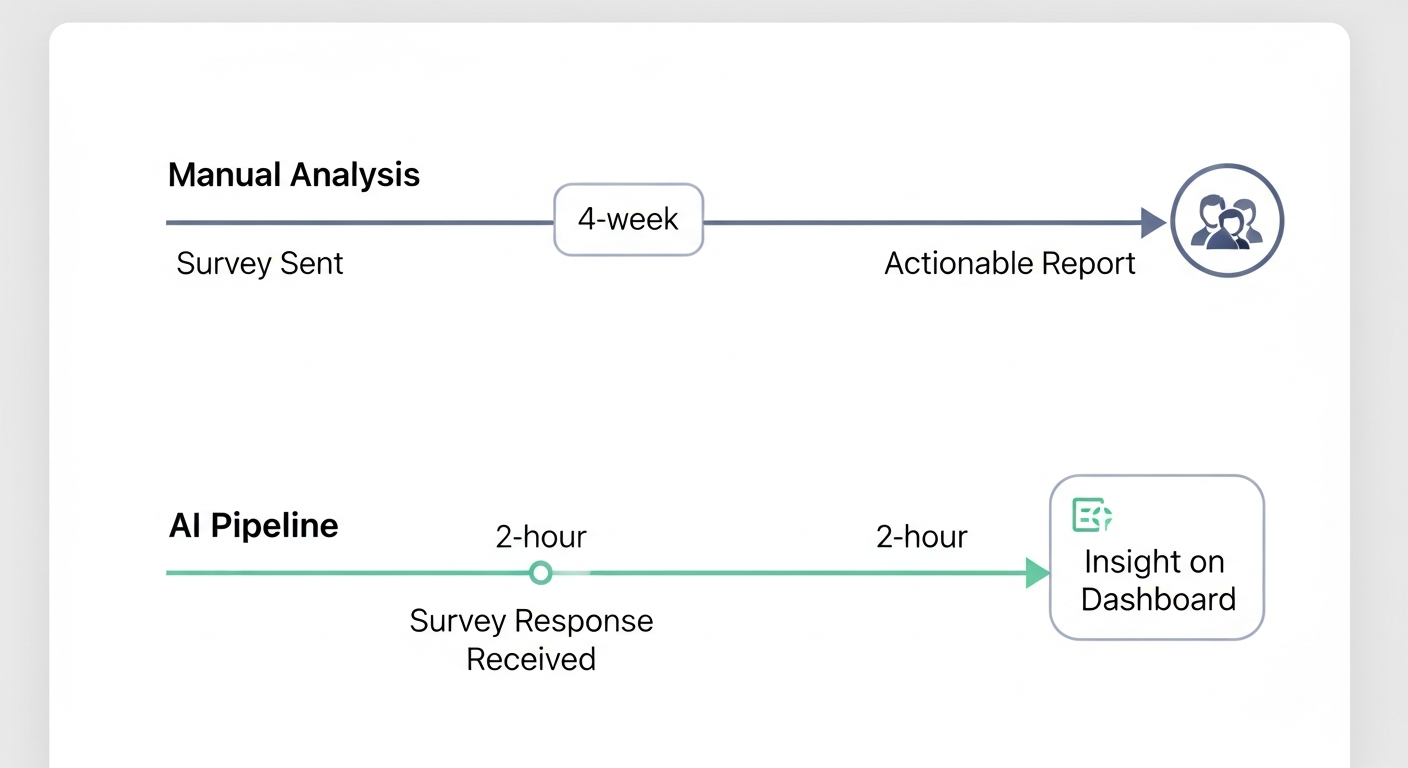
In my experience leading engineering teams, the gap between collecting customer feedback and acting on it is where competitive advantage is lost. We would run a Net Promoter Score (NPS) survey, gather thousands of valuable comments, and then what? A product manager would spend a week manually tagging responses in a spreadsheet. The resulting report would be a month old, and the engineering team would have already planned the next sprint. The voice of the customer was present, but latent.
This latency is expensive. It leads to building features nobody asked for while ignoring critical pain points. The goal of an AI-powered pipeline is to eliminate this latency. It transforms feedback from a lagging indicator reviewed quarterly into a leading indicator monitored daily.
The Architecture: An Autonomous Feedback Intelligence Pipeline
A robust feedback pipeline isn’t a single tool; it’s a multi-stage system. I’ve refined this architecture across several implementations to be modular, scalable, and secure.
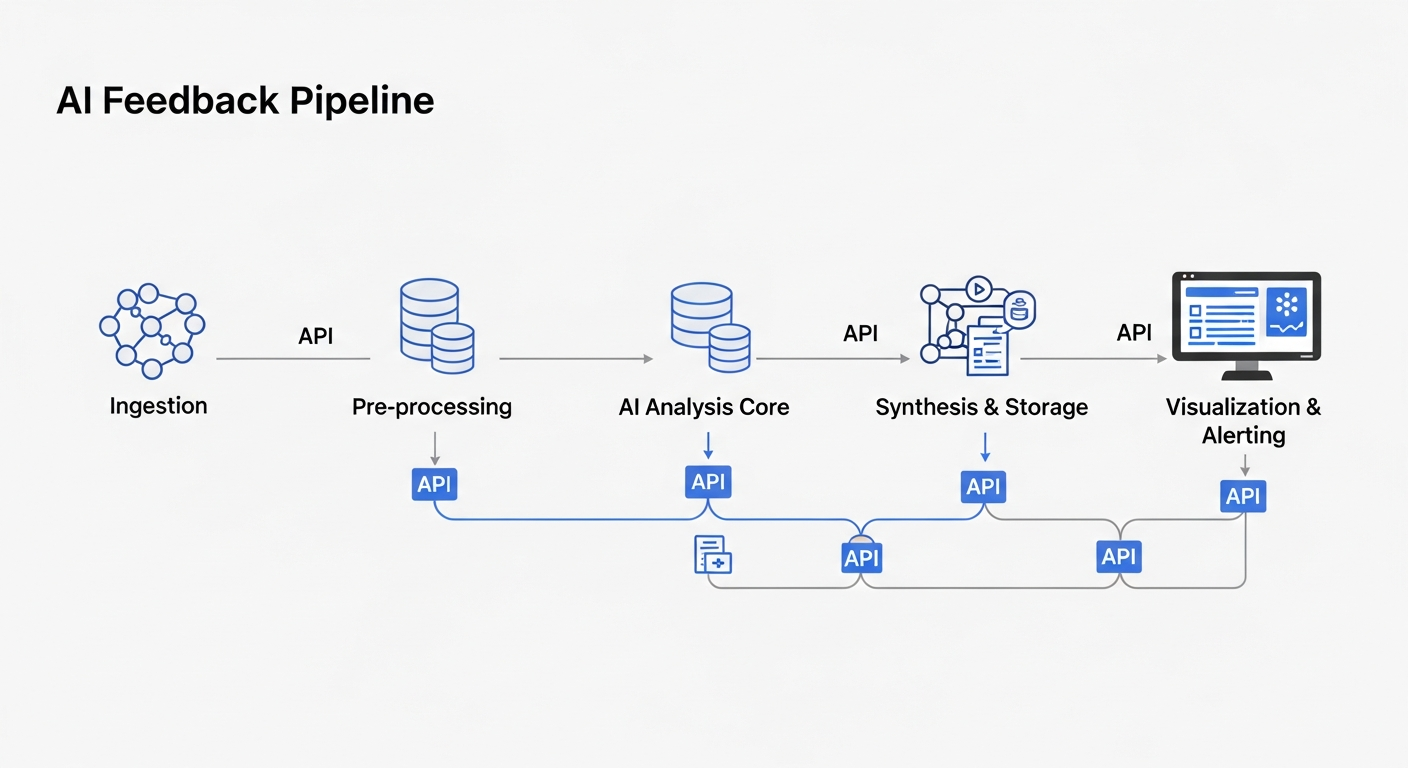
Here’s the breakdown of the core components:
- Ingestion Layer: Connects to your survey tools (SurveyMonkey, Google Forms, Qualtrics) via APIs or webhooks. The goal is to receive new responses in near real-time.
- Pre-processing & PII Redaction: A critical step. Before any analysis, I run a process to clean the text (remove HTML, etc.) and, most importantly, use a Named Entity Recognition (NER) model to identify and redact Personally Identifiable Information (PII) like names, emails, and phone numbers. This is non-negotiable for compliance.
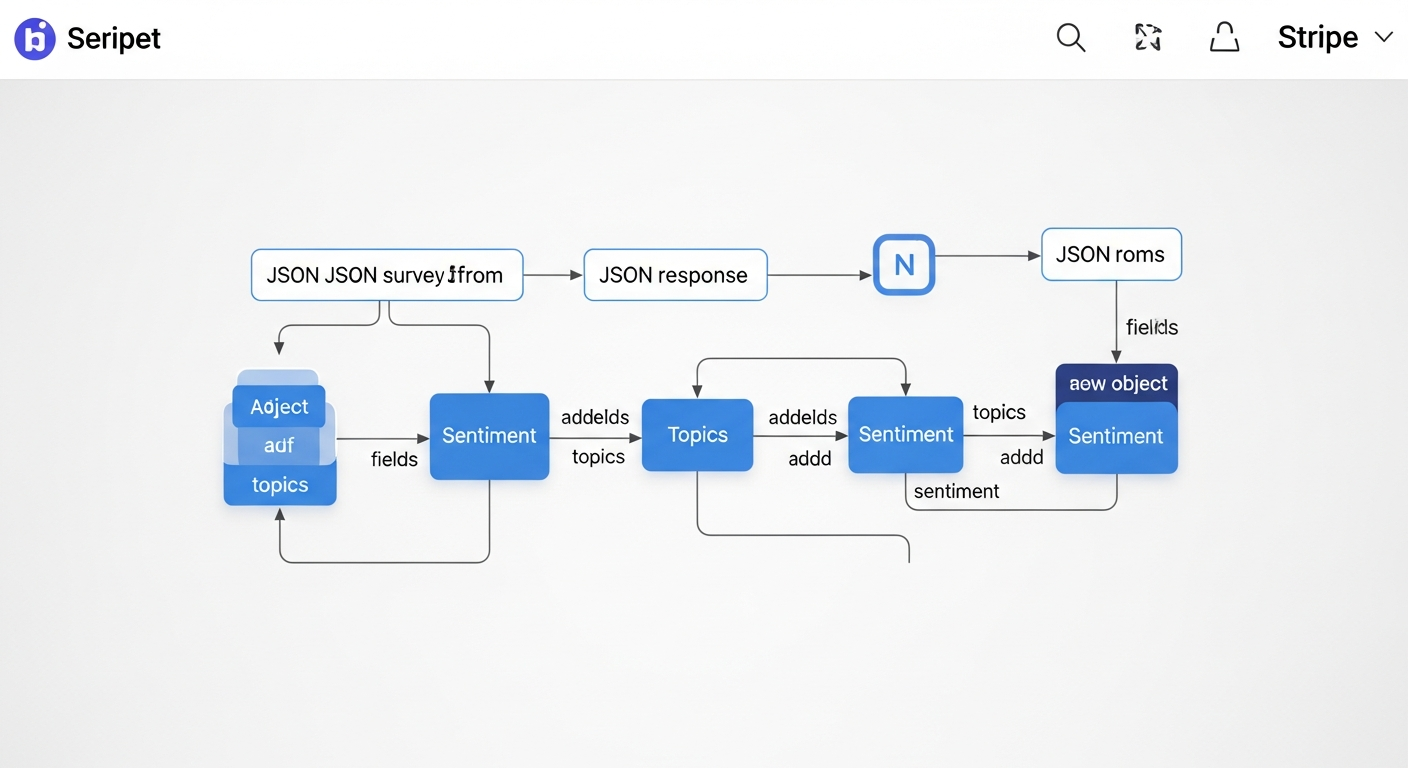
- AI Analysis Core: This is where the magic happens. A chain of LLM calls performs:
- Sentiment Analysis: (Positive, Negative, Neutral)
- Topic/Entity Extraction: (e.g., ‘UI Bug’, ‘Pricing Concern’, ‘Feature Request: API’)
- Urgency Classification: (e.g., ‘High’, ‘Medium’, ‘Low’)
- Synthesis & Storage: The structured output from the AI core is stored. I prefer a combination of a traditional SQL database for the structured data and a vector database (like Pinecone or Chroma) for the original text embeddings, which allows for powerful semantic search later.
- Visualization & Alerting: The structured data feeds into a BI tool (Tableau, PowerBI, Grafana). I set up automated alerts for critical events, such as a sudden spike in negative sentiment or a response classified with ‘High’ urgency, which can trigger a Slack notification or create a Jira ticket.
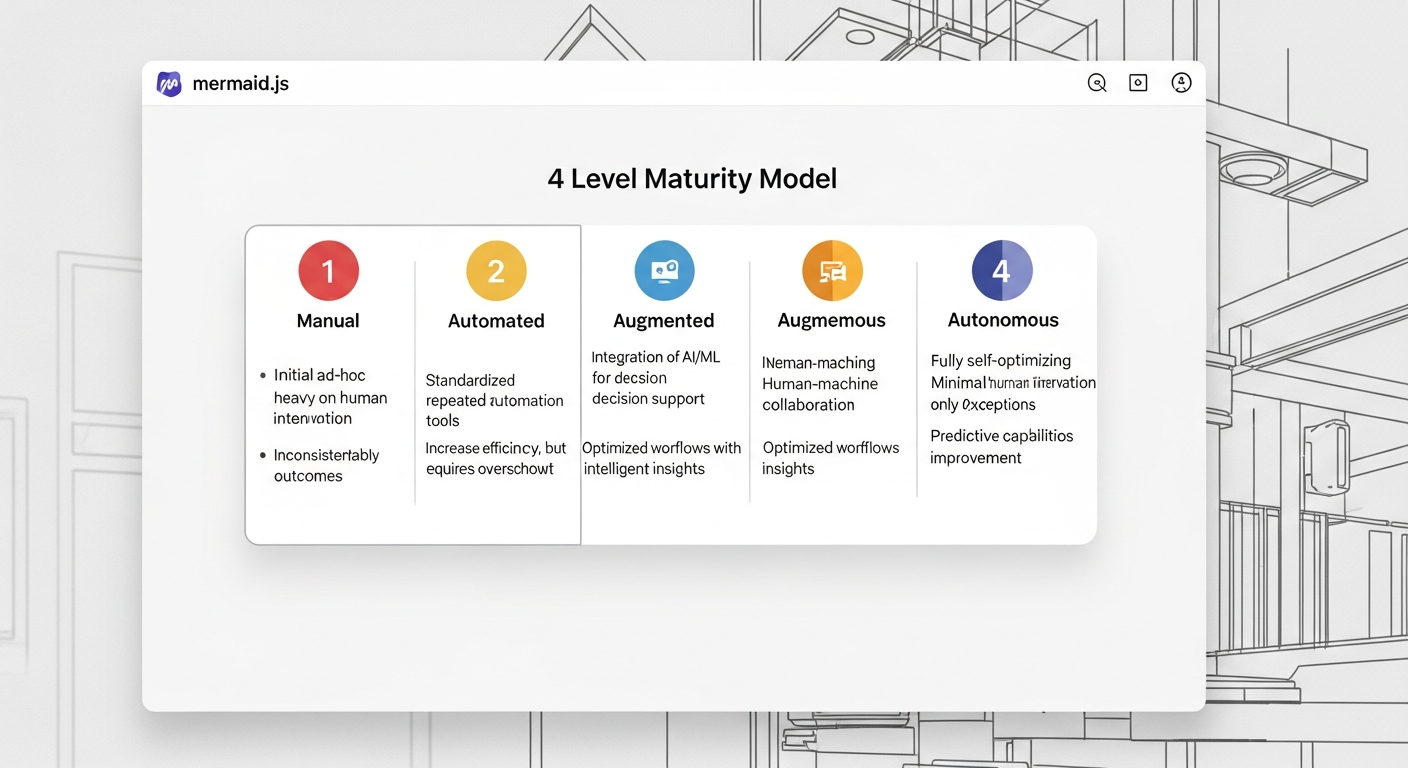
The Framework: Feedback Intelligence Maturity Model
Not every organization can build a fully autonomous system overnight. I use this maturity model to help leadership assess their current state and plot a course for the future.
mermaid
graph TD
subgraph Feedback Intelligence Maturity Model
L1[Level 1: Manual] –> L2[Level 2: Automated]
L2 –> L3[Level 3: Augmented]
L3 –> L4[Level 4: Autonomous]
end
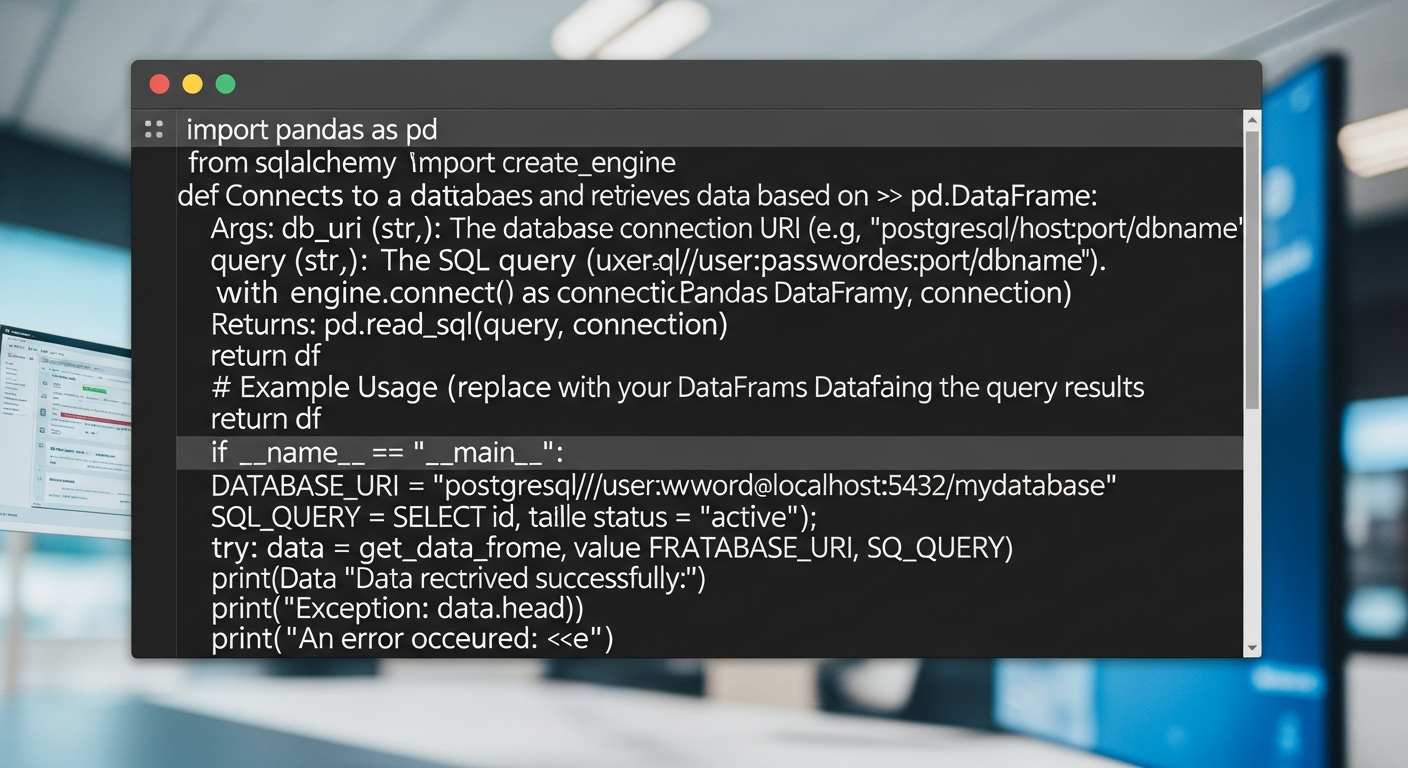
The Implementation: A Practical Code Snippet
Talk is cheap. Here is the ‘Proof of Work’. This Python snippet demonstrates the core of the AI Analysis stage using the OpenAI API. It takes a raw survey response and returns a structured JSON object.
python
import openai
import json
Assume openai.api_key is set in your environment variables
def analyze_feedback(response_text: str) -> dict:
“””
Analyzes a single survey response using an LLM to extract structured data.
“””
system_prompt = “””
You are an expert system for analyzing customer feedback.
Analyze the following text and return a JSON object with the following keys:
– ‘sentiment’: one of [‘Positive’, ‘Negative’, ‘Neutral’]
– ‘topics’: a list of key topics or entities mentioned.
– ‘urgency’: one of [‘High’, ‘Medium’, ‘Low’] based on the user’s tone and content.
– ‘summary’: a one-sentence summary of the feedback.
“””
— Example Usage —
survey_response = “The new dashboard UI is incredibly confusing and the reports are taking forever to load. I’m on the verge of switching to a competitor if this isn’t fixed soon!”
structured_data = analyze_feedback(survey_response)
if structured_data:
print(json.dumps(structured_data, indent=2))
Expected Output:
{
“sentiment”: “Negative”,
“topics”: [“Dashboard UI”, “Report Performance”, “Churn Risk”],
“urgency”: “High”,
“summary”: “The user is frustrated with the new dashboard’s usability and slow performance, indicating a high risk of churn.”
}

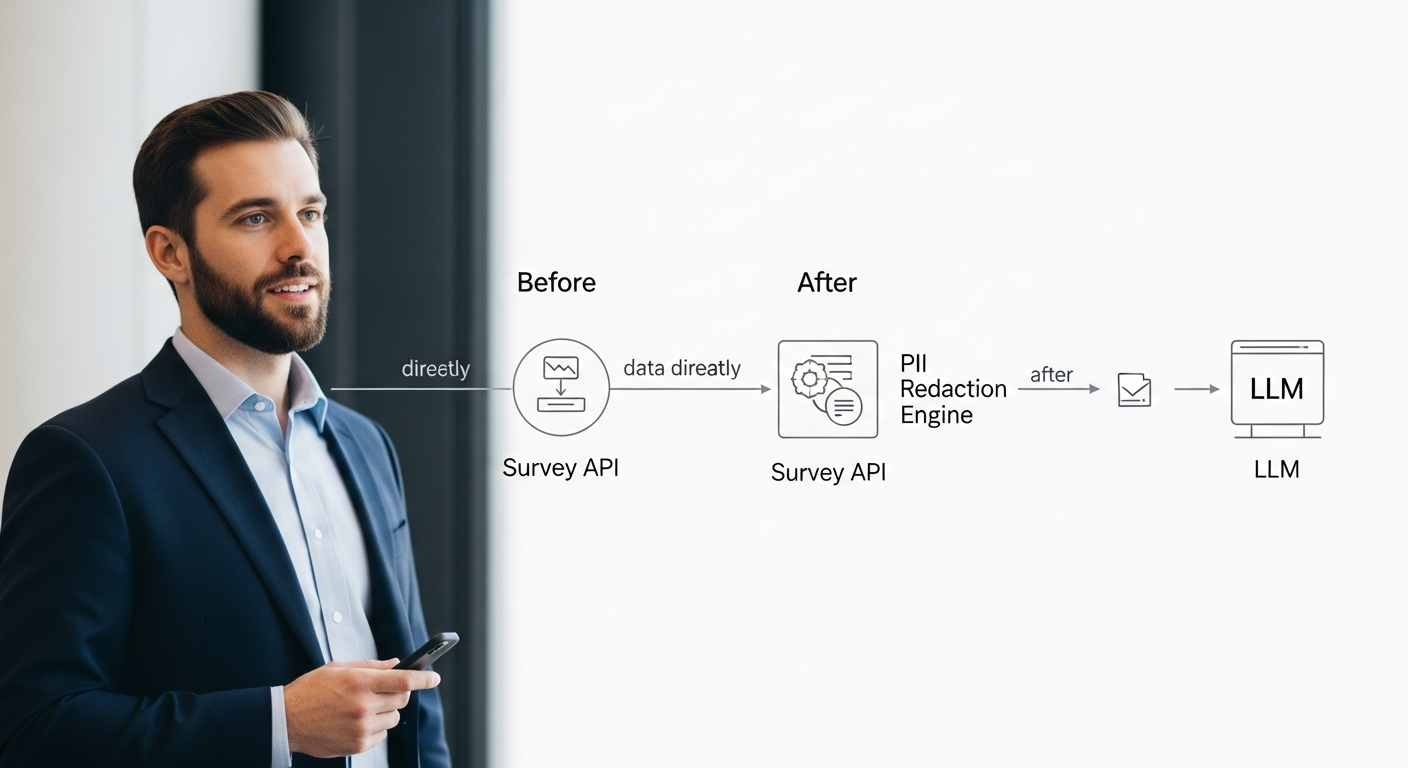
The Retrospective: A Lesson in PII
My first version of this pipeline was a huge success internally, but I made a critical mistake. I fed raw, unredacted feedback directly to the third-party LLM API. We discovered a customer had included their personal cell phone number in a comment, which was then logged in our API provider’s system. This created a compliance nightmare.
The Fix: I immediately halted the pipeline and inserted a mandatory PII redaction module before the LLM analysis step. We used a fine-tuned NER model (like one from SpaCy) to identify and replace sensitive data with tokens (e.g., [PHONE_NUMBER]). This taught me a crucial lesson: in operationalizing AI, security and compliance aren’t features; they are foundational requirements of the architecture.
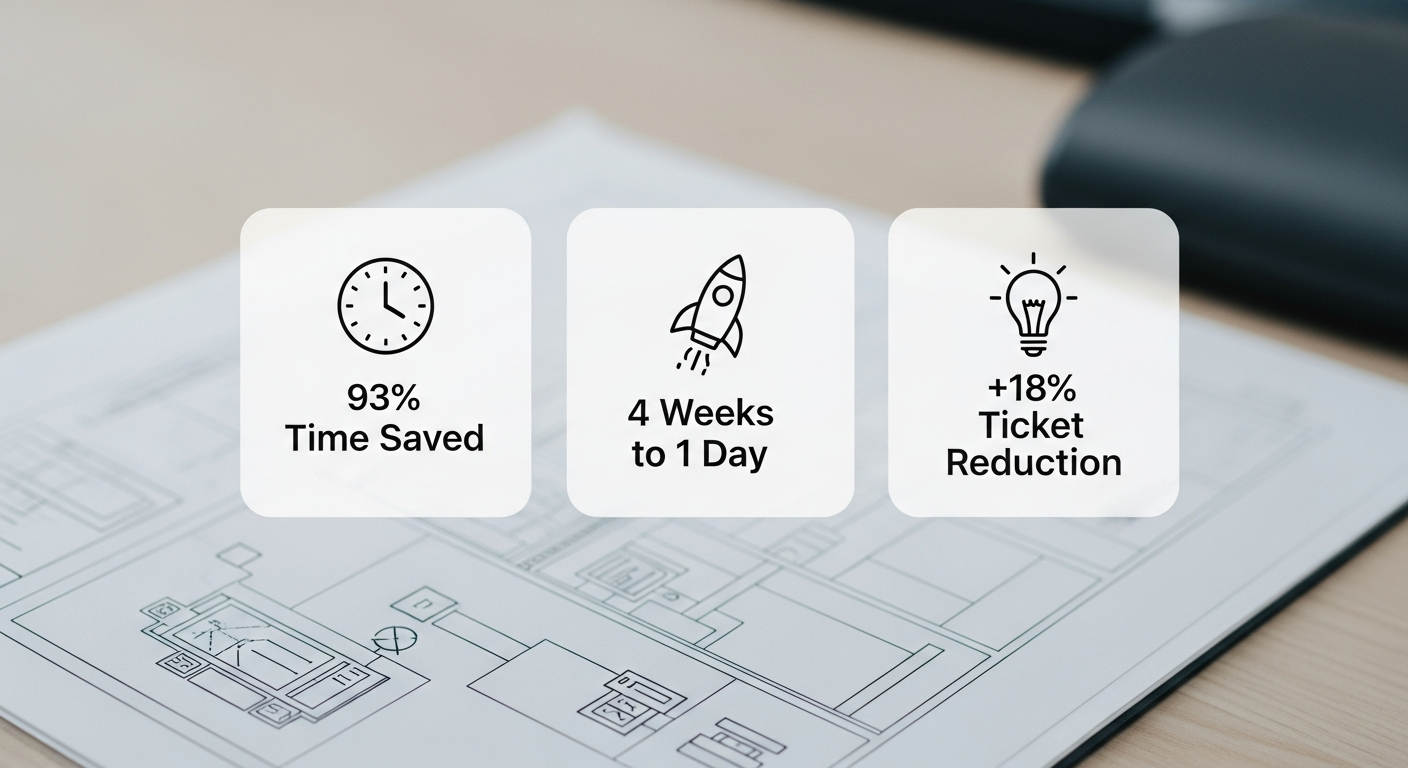
Business Impact & ROI
- Efficiency: A client with ~5,000 open-ended responses per month went from 80 hours of manual PM time for analysis to less than 5 hours for review and verification. A 93% reduction in manual effort.
- Speed: The insight cycle was reduced from 3-4 weeks to under 24 hours, allowing the product team to react to emerging issues within the same sprint.
- Discovery: The pipeline automatically surfaced a recurring complaint about a specific API endpoint that was buried in the long tail of feedback. Fixing it reduced customer support tickets by 18% for that product area.
Conclusion
Stop thinking about surveys and start thinking about systems. By operationalizing AI, you can build an intelligent pipeline that transforms customer feedback from a static, historical artifact into a living, breathing source of strategic direction. This is the role of the modern technology leader: to be an ‘Operational Architect’ who builds the systems that bridge the gap between high-level strategy and the engineering reality of what to build next.
FAQ
-
How do you handle data privacy and PII beyond the example?
The PII redaction step is critical. For maximum security, I recommend a self-hosted NER model to avoid sending raw data to any third party. You must also have clear data retention policies and ensure your pipeline is compliant with regulations like GDPR and CCPA, which includes honoring data deletion requests. -
What’s the typical cost to build and run a pipeline like this?
Initial build can range from 2-4 engineering weeks depending on complexity. Running costs are primarily LLM API calls. For a few thousand responses a month, this can be as low as $50-$200. The ROI from saved manual labor and faster insights almost always justifies the cost within the first quarter. -
How does this compare to off-the-shelf solutions like Qualtrics XM or Medallia?
Those are powerful platforms, but they can be expensive and inflexible. Building your own pipeline gives you full control over the logic, the data, and the integration points. You can customize the analysis for your specific business context and avoid vendor lock-in. My approach is for leaders who want to own their core intelligence systems. -
What’s the biggest mistake teams make when implementing this?
Focusing only on the AI model and ignoring the plumbing. A successful project is 80% data engineering (ingestion, cleaning, storage, alerting) and 20% AI. Without a robust, reliable pipeline, your fancy analysis is useless. -
How do you ensure the AI’s analysis isn’t biased or hallucinating?
Validation is key. I always start by having the AI analyze a ‘golden set’ of a few hundred responses that have also been manually tagged. We compare the results to measure accuracy. We also build in a ‘human-in-the-loop’ interface where product managers can easily review and correct the AI’s output, which can be used to fine-tune the model over time.